17 pages
Revenue
How much we sold, of what, to whom, at what margin, compared with last year.
Margins · Customers · Agents · Budget · Italy/Export
Product sheet · version 1.0
Before, 90% of the time went into pulling out the numbers and 10% into deciding. Now all of that time can go into deciding.
01 · Three reports, one truth
All three read the same archive: two people never again walk into a meeting with two different totals.
17 pages
How much we sold, of what, to whom, at what margin, compared with last year.
Margins · Customers · Agents · Budget · Italy/Export
8 pages
What is in the order book, when we will deliver, where we are running late.
By confirmation · By shipment · Weekly
7 pages
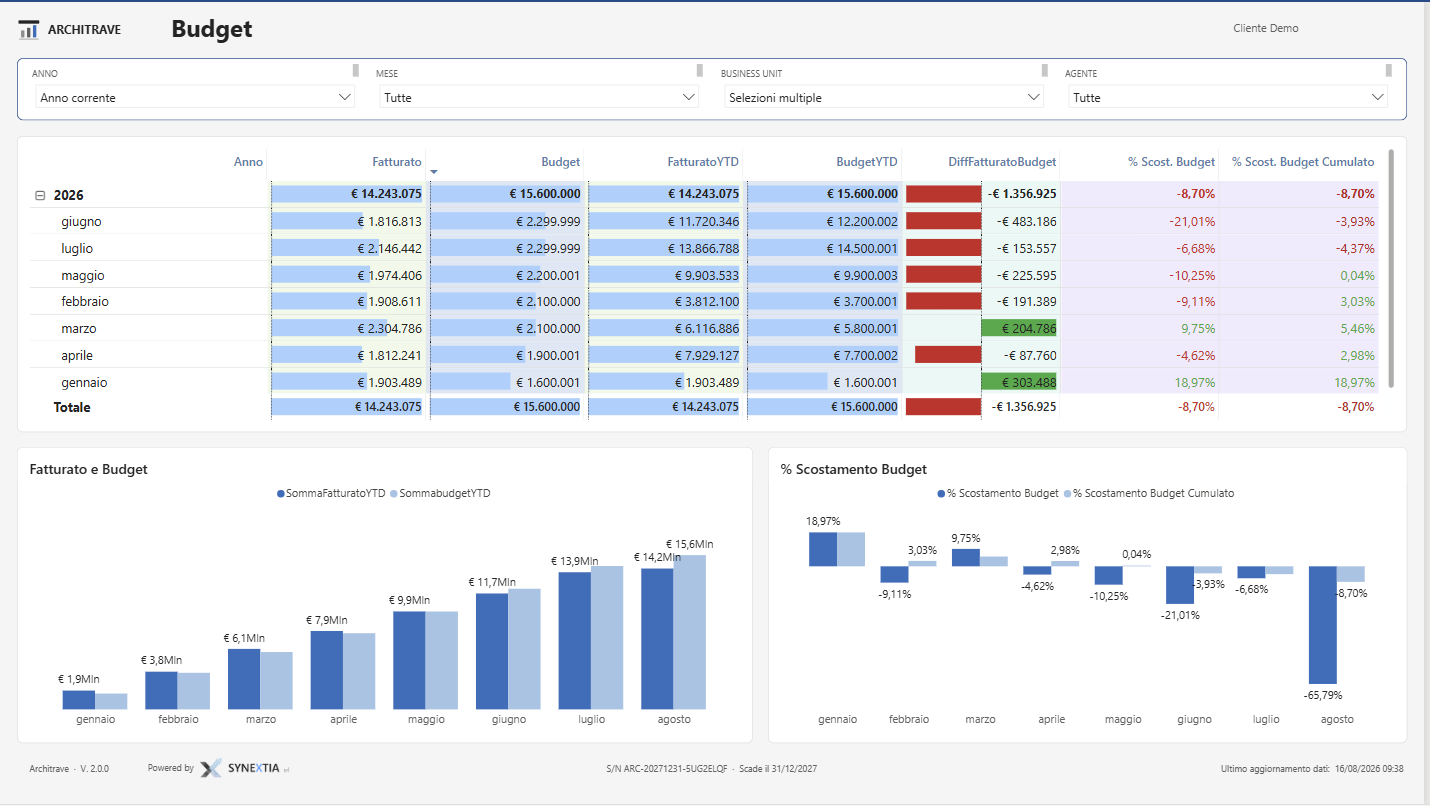
Where we stand against budget, month by month and cumulative from January.
Revenue vs budget · Sales plan
02 · What changes in the business
03 · How concentrated we are
A question rarely asked and well worth asking often. One click on a slice or a bar filters the whole page; a second click puts everything back.
Euros and quantities stay separate: revenue up with quantities down means higher prices on less product. The traffic-light thresholds live in a file the company updates whenever it likes.
04 · Honest comparisons, in your pocket
Revenue and budget side by side: the month on its own and the year-to-date from January, which is the number that counts at year end. Future days are excluded — in September revenue is compared with the budget up to September.
The budget is spread over working days: holidays and shutdowns don't count, so August isn't a disaster just because the plant was closed. Variance always carries both colour and sign: it reads in black and white too.
05 · Revenue against budget
Bring an extract from your ERP: we will show you your own pages, not a catalogue of examples.